TOP
CORPORATE INFO
INVESTOR RELATIONS
CONTACT US
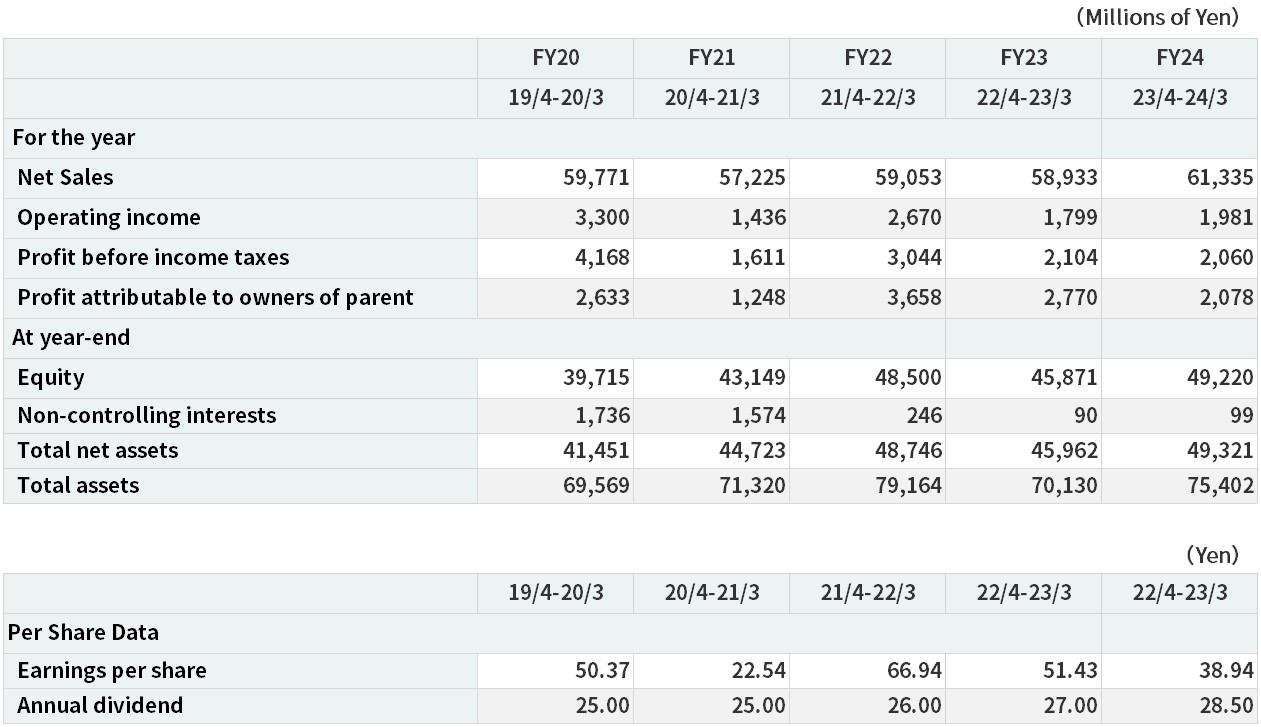
FINANCIAL HIGHLIGHTS
CONSOLIDATED FINANCIAL HIGHLIGHTS
Updated on April 27, 2026
Share
Tweet
ZENRIN
INVESTOR RELATIONS
FINANCIAL HIGHLIGHTS